

Membership Dashboard
This dashboard is a membership management tool that provides an at-a-glance status of an organization’s membership data. It centralizes membership information, reducing the time and effort required to manage and track membership applications and statuses.
- Decision Support: With real-time data on the number of members, types of memberships, and fees collected, decision-makers can assess the health of the membership base and financials.
- Financial Management: The dashboard shows how fees are paid, which helps in forecasting cash flow and understanding financial trends.
- Membership Growth Tracking: By displaying membership numbers over the years, it helps in evaluating the effectiveness of recruitment efforts and overall growth.
This dashboard is designed to streamline the management of an organization's members, provide strategic insights, and support operational efficiency. It’s a valuable tool for membership coordinators, financial officers, and organizational leaders.
Donation Dashboard
This dashboard is a donation tracking tool that offers real-time insights into fundraising efforts. It’s segmented into several components that provide a comprehensive overview of donations received over various time frames and categorizations.
- Donor Engagement: Having a detailed record of donors aids in recognizing and engaging with them, which is critical for maintaining and building donor relationships.
- Financial Oversight: It provides essential data for financial reporting and transparency, showing where funds are coming from and how they’re distributed among projects.
- Strategic Planning: The trends and patterns observed in the donation data can inform strategic decisions about fundraising campaigns and outreach efforts.
This dashboard is useful for non-profit organizations, fundraisers, and financial managers who aim to effectively track and manage donations, engage with donors, and make informed decisions about their fundraising strategies.


Online Shop Dashboard
This dashboard is designed for the performance tracking of an online shop, providing key metrics on sales figures and customer interactions.
- Understanding Customer Behaviour: By tracking top customers by sale amount, businesses can identify their most valuable customers and tailor marketing efforts to retain them.
- Monitoring Sales Performance: Users can monitor current and historical sales performance to identify trends and inform stock and marketing decisions.
- Revenue Tracking: Tracking sales revenue in real-time allows for immediate financial oversight and can help in forecasting future performance.
Overall, this dashboard is a valuable tool for business owners, sales managers, and marketing teams of an online shop to keep track of sales performance, optimize inventory and marketing strategies, and build customer relationship management tactics.
SALES ANALYSIS dashboard
This dashboard provides a comprehensive view of a company's sales performance, enabling stakeholders to understand trends, make informed decisions, and identify areas for improvement.
- Performance Tracking: To monitor sales performance over time and measure against targets and historical data.
- Strategic Decision Making: To guide strategic planning with insights into which industries, products, and sales personnel are driving revenue.
- Operational Insights: To identify cost trends and profit margins, providing opportunities to optimize operations and pricing strategies.
- Responsibility Assessment: To evaluate the performance of sales staff and manage human resources effectively by recognizing achievements or addressing underperformance.
- Product Analysis: To assess which products are performing well in terms of sales and profits, which could influence marketing and production decisions.
Overall, this dashboard is a vital tool for business leaders, sales managers, financial analysts, and other stakeholders who need a clear, concise, and visual representation of the company's sales health to support data-driven decision-making.

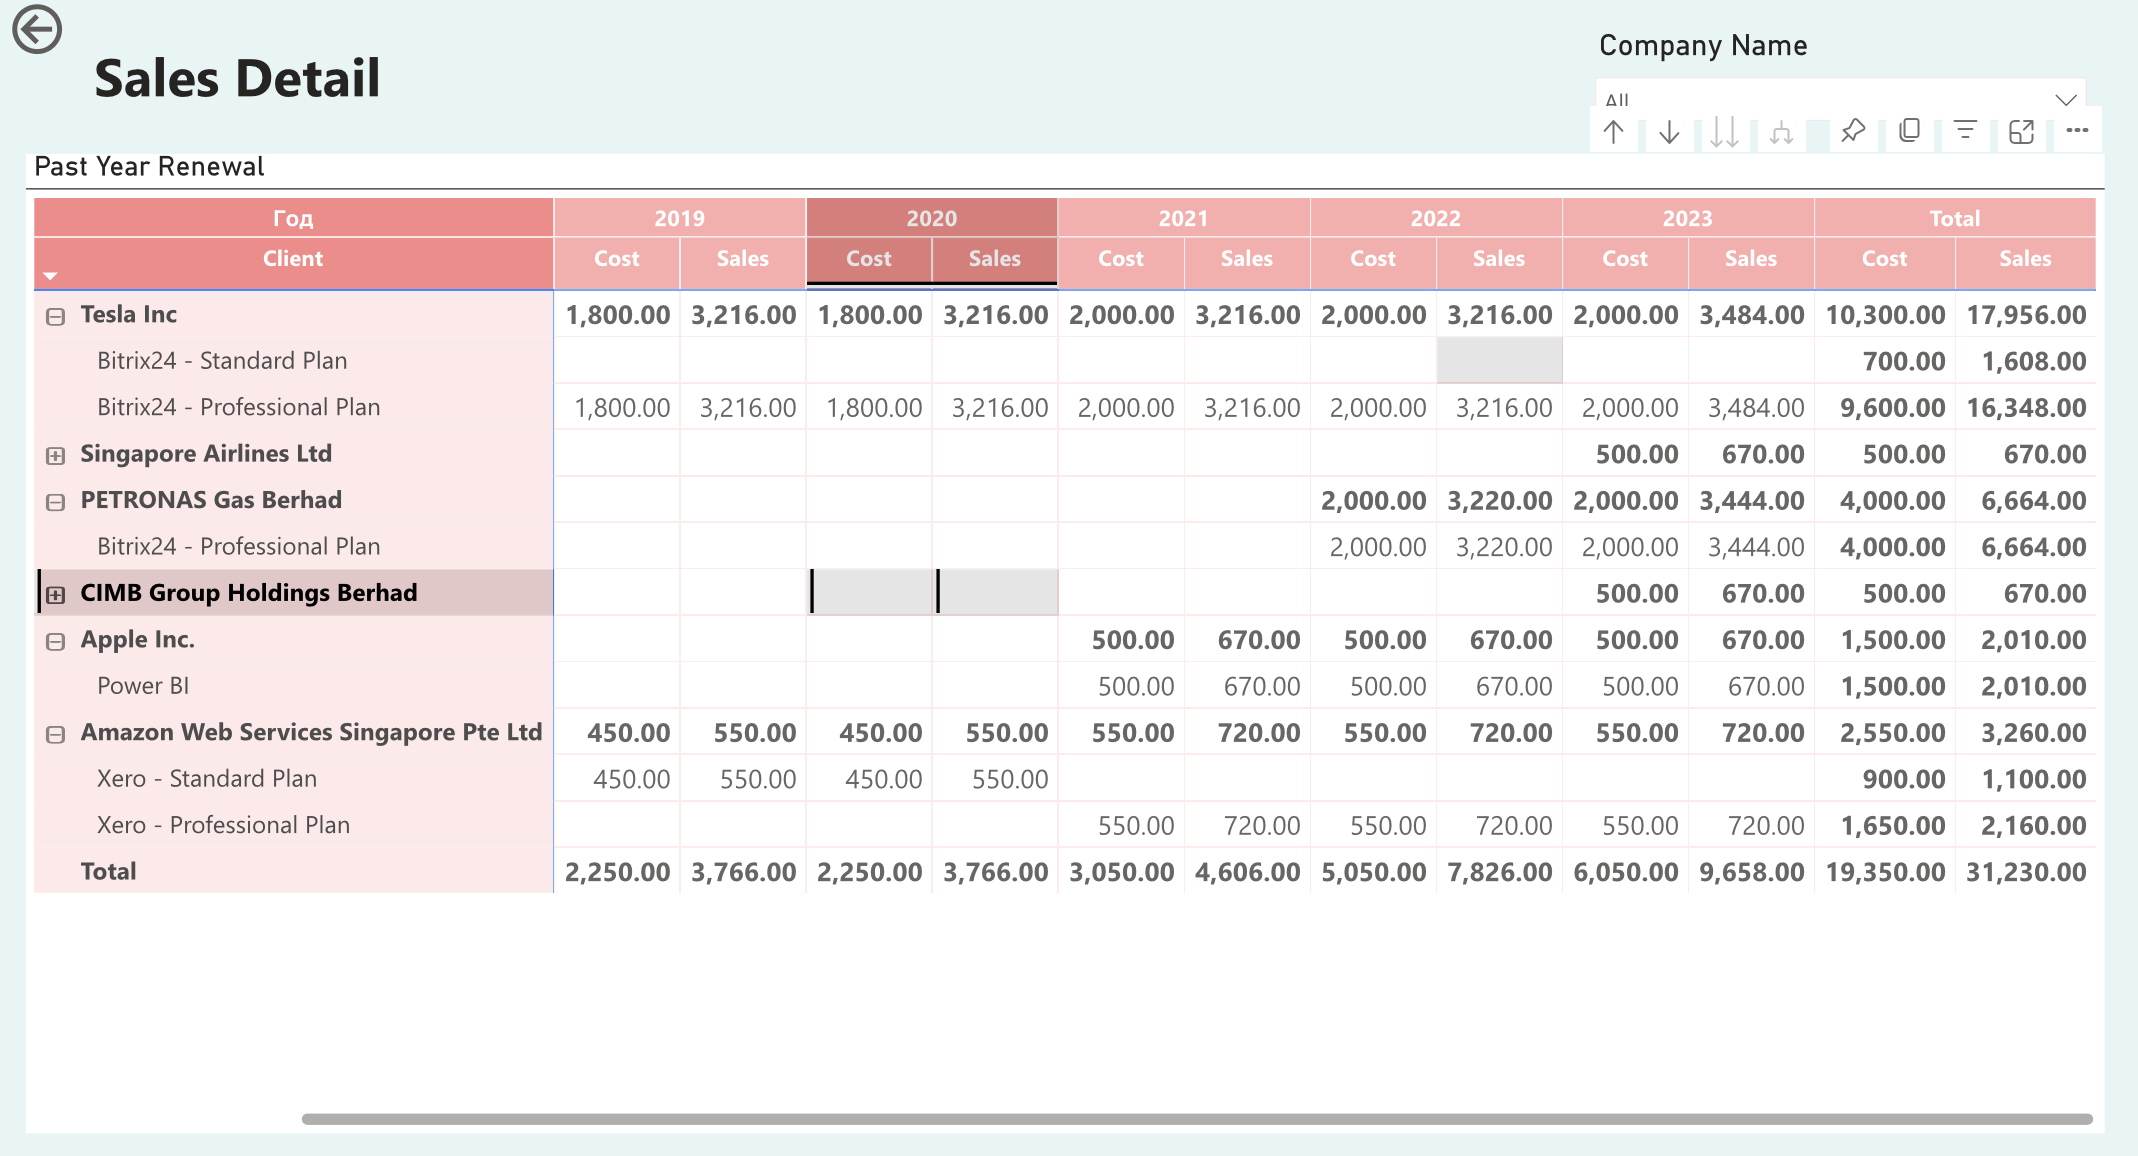
SALES DETAIL
This dashboard titled "Sales Detail" seems to be focused on tracking the cost and sales data for various clients and products year over year. The table layout provides a yearly breakdown of the financials, allowing for detailed analysis of sales and cost trends per client and by individual service plans or products sold.
The purpose of this dashboard is likely to help the sales team, account managers, and financial analysts to:
- Track sales and cost performance of each client.
- Identify the profitability of different service plans or products.
- Monitor client renewal rates and the effectiveness of the sales strategy over multiple years.
- Assist in forecasting and setting targets for future sales efforts.
- Provide a historical record for reference in planning and negotiations with clients.
LICENSE RENEWAL TRACKING
The dashboard presented is a "License Renewal Tracking" system, which serves as an essential tool for businesses that rely on software licenses, subscriptions, or any services that require regular renewals, where it helps to:
- Avoid Disruptions: Keeping track of license renewals is critical to avoiding service interruptions. An expired license can lead to downtime, which can be costly and disruptive to business operations.
- Status Tracking: With the status indicators, management can quickly see which licenses are on track for renewal, which ones need a follow-up notice, and which ones require immediate action due to pending payments or other issues.
- Prioritization: The dashboard allows for the prioritization of renewals based on the expiration date, cost, or criticality of the software to the business, ensuring that the most important licenses are renewed first.
This dashboard is an essential management tool that provides oversight and control over the license renewal process, which is crucial for operational continuity, financial management, compliance, and strategic planning.


TICKETING
The dashboard you've shared appears to be centered around ticketing and customer satisfaction for a service-oriented business or IT support system. Here’s how it breaks down:
- Performance Monitoring: The dashboard provides clear metrics for monitoring the performance of service engineers and the satisfaction of customers over time.
- Workload Management: It helps in distributing workload evenly among engineers and identifying if additional resources are needed based on ticket volume.
- Quality Assurance: By tracking customer satisfaction scores, management can identify areas for service improvement and staff training.
This dashboard is a valuable tool for service managers, quality assurance teams, and customer support analysts who aim to optimize service operations, improve customer satisfaction, and enhance team performance.